ELECTRIC VEHICLE POWERTRAIN SYSTEMS ENGINEERING FOR PERFORMANCE AND THE CHALLENGES WHEN COMPARING TO ICE POWERTRAIN PERFORMANCE
- By S. E. Tice
- •
- 04 Aug, 2020
- •
by S.E. Tice…
Why do electric powertrains not perform like ICE (internal combustion engine) powered ones in track situations? (however for drag racing, high performance electric vehicles do just fine). What’s this “throttling” all about w.r.t. BEV range, performance, and charging capability? Fielding questions like this, there seems to be continual “puzzlement” in comparing power obtainable from Electric (all-electric or BEV – battery electric vehicle) vs ICE powertrains, especially when one wants to drive the vehicle aggressively or in track applications. This article will attempt to explain some of the overview level issues in comparing the two types of vehicle powertrains.
In general, ICE powertrains, if properly cooled, can produce peak power and torque for longer durations than electric powertrains. Simply put, the power (horsepower – hp or kilowatts – kW) production chain for an electric powertrain looks like this -> battery system (ESS – energy storage subsystem) -> the controller(s)/inverter(s) -> electric motor(s). In general, these 3 main elements produce the motor shaft hp/kW (different than and usually greater than hp available at wheels). Only looking at a high power electric motor and its inverter/controller vs. a high power ICE, observe the power/torque vs. RPM curves below. For the electric powertrain, the Tesla Model S and Borg-Warner IPM (internal permanent) motor figure below also shows typical power vs. RPM trends.
High Power IPM Electric Motor based drive subsystem (top figure below) and Tesla Model S drive subsystem (dotted lines are power in kW) vs. high Power ICE (lower figure below)


The weakest link in this chain determines the maximum motor shaft horsepower that can be obtained for peak short duration and continuous operation of the electric powertrain. The demand for peak hp vs. time requested by driver may reveal one of these 3 components, even if cooled properly, can not sustain the power being requested. When performing the systems engineering and design of an electric powertrain, the top requirements driving the design is what the worst-case operational scenarios will be for the powertrain, so components and subsystems can be sized accordingly for these conditions. Quantifying these vehicle load profiles can sometimes be done using actual track data if the car is instrumented to record data that can be translated into power demand vs. time.
The “battery hp”, or “battery electrical “horsepower” or “battery chemical horsepower” in most cases is the limiting factor in producing the maximum “motor shaft horsepower” over time of driver request and its power changes as the State of Charge (SOC) of the ESS changes over time of use. The ESS voltage x current in amps x “ESS cell type factor” = power in watts x 1.34 = power in hp. However, the controller-inverter and motor power output decreases as the ESS SOC and voltage decrease, known as “voltage sag”, (unless regen braking is able to maintain SOC by putting energy back into the ESS), as shown in example figure below. For Lithium (LiFePO4) Batteries, some designers simply use a conservative “ESS cell type factor” of 80% to summarize the maximum discharge characteristics of the ESS cells being used, such that the Voltage x Amps x .80% = Usable Available Power.

Not all cells produce their “peak or maximum” current for same amount of time and have same voltage sag while producing this current plus due to a cell’s internal resistance, may heat up faster, hence requiring more effective cooling to allow it to deliver the requested power for longer time periods. For example, let’s think of individual cells within an ESS as the whole ESS as an illustration, and say we consider a cell which is a compromise between energy and power, such as the SDI INR18650-30q, a max 5C (15 amps or 5 x its 3ah rating) for max discharge of 10-20 minutes (“full throttle”), while we keep the cell temperature is below its permanent damage temp (70-75°C).
Continuing with our illustrative example, see figure below showing discharge vs. time and notice how the voltage drops vs. time at max recommended discharge of 15 amps and the total time the cell produces its max continuous current of 15 amps – again, imagine that this set of curves is for the whole ESS voltage (not just one cell) as it is dropping this fast when “full throttle” is applied and its effect on the power output from the controller-inverter and motor. It must be mentioned that depth of discharge (or lowest level of state of charge – SOC, and not going above 15 amps – think of this level of discharge as “full throttle” until cell gets to its lowest recommended level of charge state) and cooling is critical to avoid shortened cycle life of ESS cells. This specific cell could lose 20% of its charge/discharge cycles if these operational parameters are not strictly controlled. Going above 15 amps, the Samsung 30Q datasheet (Section 7.9) mentions operation at 20A (short “power bursts”), however operation at that level can be done as long as we don’t let the battery get above 75°C, its maximum rated operating temperature. https://imgur.com/a/VOxh5 (great resource on SDI INR18650-30q test results and other cells testing is Mooch)
As you can see from these curves, very light hp demand (not much fun on the track) from the powertrain results in long time duration for the ESS energy delivery (~3 hours at 1 amp to ~14.5 hours duration at .2 amp to minimum acceptable voltage for this cell) before ESS voltage starts dropping which will reduce the potential for peak hp when demanded. Larger ESSs (higher kWh capacity) would then demand less current per cell (see lower amp discharge curves below, hence increasing time ESS can produce more hp. There are more technical issues involved in proper high performance ESS design that go beyond the objective of this article, like cell internal resistance (IR) creating cell heating at high discharge currents (we always seek lowest IR cells for performance ESS designs), ESS/cell cooling system effectiveness, etc. Refer to Tesla Model S on the track below. (figure src: https://lygte-info.dk/review/batteries2012/Samsung%20INR18650-30Q%203000mAh%20%28Pink%29%20UK.html )

On the flip side of the max cell discharge scenario is the very crucial max charge scenario which occurs during regen braking while driving the electric powertrain aggressively. If one can optimally use regenerative braking and maintain higher ESS SOC and hence voltages, than higher power can be obtained. Usually an ESS cell max discharge and charge are closely related in terms of performance. An important side issue is that battery cells have an estimated number of full charge and discharge cycles tied to their cell temperatures, so depending on conditions controlling fast charge rates from either external charger or a car’s regen system is quite often designed in by major OEMs. (Tesla for example “throttles” down the max charging rate to avoid damaging the car’s batteries)
This is a good article to dive deeper into the obtainable “ESS or battery hp” for an electric powertrains, even though the discussion is for ESSs at a smaller scale – the math is the same. https://insideevs.com/ev-nerdgasm-batteries-cbre-dream-build-next-chapter/
State-of-the-art high power inverter/controllers tend to have short peak power time periods, e.g. 30 seconds, so one would use its maximum continuous current rating of these devices to size a powertrain for a specific desired “peak hp”. This also applies to the motor itself, even if properly cooled. 30 second burst peak power capability may be adequate for a 0-62mph runs, but as has been shown with road versions of Tesla Model S on the track, which was not designed for optimal track performance, constant requests for peak power produces over-heating and forces the system to degrade the allowable power or “throttling down” to what the system can produce continuously, keeping all components in their proper temperature range and not over-stressing the ESS cells. (see linked articles below for supporting evidence)
JB Straubel, CTO, Tesla explains the challenges in communicating “maximum horsepower” of an electric powertrain compared to an ICE powertrain. “There is some confusion about our methodology for specifying ‘equivalent’ horsepower ratings for our all-wheel drive, dual motor vehicles,” Straubel said. “Attempting to directly correlate horsepower ratings in petroleum burning vehicles to horsepower in an electric vehicle is a difficult challenge.” https://www.tesla.com/blog/tesla-all-wheel-drive-dual-motor-power-and-torque-specifications
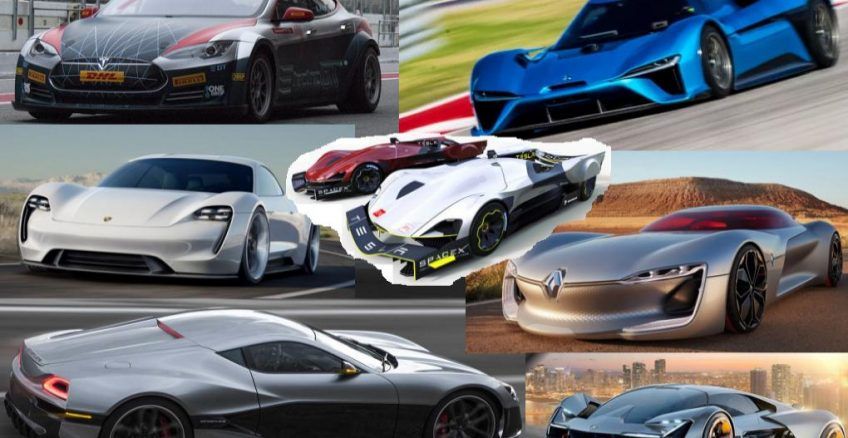
As impressive as the new racing series “Model S for racing”, called the “Electric GT Model S P100D” was on the track, however, the Model S powertrain was not designed for track use. British racing driver and former Top Gear and Fifth Gear television presenter Tiff Needell recently got behind the wheel of the Electric GT’s Tesla Model S P100DL race car. https://www.teslarati.com/tesla-model-s-p100dl-electric-gt-track-tested/ Tiff Needell ultimately noted that the vehicle’s battery (ESS) still showed some heating issues, as revealed by the Model S’ control system throttling (reducing) performance to safegauard the powertrain, after only 1.5 hot laps around the Barcelona track and fans were required to be directed over the vehicle’s battery pack after runs in an attempt to lower the ESS temps – the ESS cooling system needs an upgrade. The veteran racing driver stated, however, that if Electric GT can find a workaround with the Model S’ battery heating issues, the racing series could very well be quite successful. However, the Model S P100DL powertrain does do quite fine in drag racing where it is able to accelerate harder than it can brake.
The Tesla Model 3 powertrain design has considered track or aggressive driving as one of its “worst-case” scenarios and recent tests show good results when compared to the Model S track performance as mentioned above and in this linked article. “Model 3 was able to handle nine laps on a racetrack without the car’s software limiting or throttling of its performance, so this is noteworthy.” https://www.teslarati.com/tesla-model-3-laguna-seca-raceway-track-racing-video/ Adding to this success, just recently, a non-Performance Long Range Model RWD Model 3 with aftermarket suspension and brakes won the Canadian Sport Compact Series Time Attack series, defeating a Porsche Boxer and a Mazda RX-8 to claim the title. During the entire event, Sasha Anis, the driver of the vehicle, noted that the Model 3 did not experience any heating problems at all. The Model 3 Performance, which Elon Musk stated would be 15% faster than a BMW M3 around the track, is expected to perform even better during spirited driving.. The upcoming dual motor Tesla Model 3 performance version may even have a “track setting” for improved longer duration high hp demands and regen capabilities.
TAKE-AWAY POINTS: Electric powertrains vs. ICE powertrains
1 – Peak torque at zero electric motor RPM is a great advantage over ICE powertrains. Current top performing stock BEV cars best their ICE powered brethren.
2 – Weakest link in electric powertrains is usually the ESS when longer time duration max hp is demanded. In addition, optimized ESS cooling systems are required. (in our powertrain designs for performance, a/c boosted chillers are used in the ESS cooling loop to assist)
3 – Both max discharge and charge performance of ESS cells are crucial for power production and effectiveness of regenerative braking
4 – Large capacity ESSs can greatly help in producing more power for longer durations, where the voltage decrease or “sag” and current demanded per cell are both less, however a properly cooled ICE powertrain can produce peak power for longer durations.
5 – Regenerative (regen) braking of electric powertrains allows recovery and transfer of kinetic energy into additional electrical energy or range stored in the ESS (battery system) for the vehicle, minimizing lost energy due to heat, as is the case with mechanical brakes – a regen powertrain will decrease wear and maintenance on mechanical brakes.
Stay tuned to this post … updates to be added as more questions arise …
by S.E.Tice …
Which DC Fast Charger Standard will win, or will regions have to have multiple standards, or will the world be divided into regions using different standards?
UPDATE on Porsche Fast Charging – see below
There are four main DC Fast Charger (a.k.a. DCQC – DC Quick Charge) contenders:
- CHAdeMO used worldwide – 40-60kW limit, with tech upgrades 100kW possible
- CCS (Combined Charging System) – two versions (different in North America and Europe, rest of the world uses one of version depending on the market) – used by BMW, GM, VW, and other carmakers – 50kW typical, 350kW possible.
- Tesla Superchargers – two versions (different in North America and Europe/rest of the world) – up to 120kW
- GB/T China – only used in China – BYD among other Chinese companies use this. Mahindra and Tata electric cars also use this standard – 50kW typical – over 150kW possible.
Tesla DC Fast Charger is proprietary for good reason – Tesla built their own SuperCharger network around the world, but do the rest of the vehicle OEMs have to support multiple standards especially when the CapEx to install these chargers is nontrivial? World map Overview of AC and DC 3 Levels
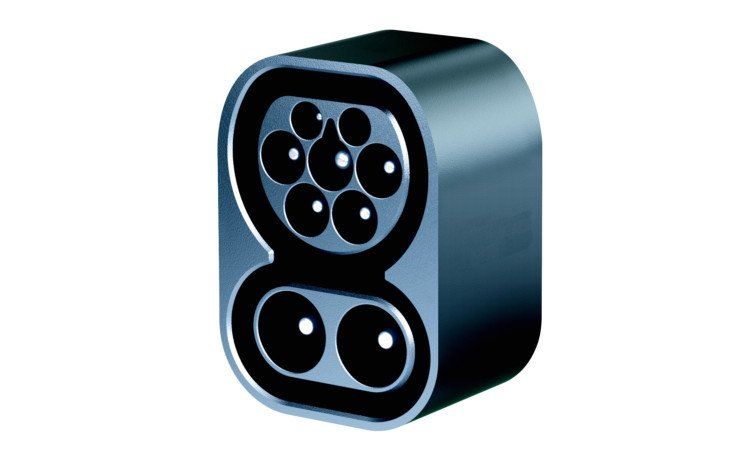
Here are the connectors and inlet s – most promising is the CCS Type 2 shown below (See below, Porsche makes its choice for DC Fast charger standard)

by S. E. Tice…
“The conclusion is that All-Electric Vehicles (BEVs) beat the fleet average ICE vehicle hands down in every group of states they evaluated, on a full lifecycle emissions basis, and in fact they outperform the Prius (52 mpg (4.5 L/100km)) in most states. In the most populous states, BEVs beat the Prius by a substantial margin. And that result is going to get nothing but better in future.” “overall Prius source to wheels efficiency at 0.8*0.38 = about 30% efficiency. And that’s the best ICE car you can buy…even fueled by a modern gas power plant”
Good analysis and article by Paul Martin, Chemical process development expert, and EV and renewable energy advocate, on all-electric vehicles vs the highest efficiency hybrid vehicle available today. https://www.linkedin.com/pulse/energy-cycle-efficiency-vehicles-does-ev-really-win-paul-martin/
Another good article by Paul Martin which developed some of the analysis data for the above article. https://www.linkedin.com/pulse/so-exactly-how-much-electricity-does-take-produce-gallon-paul-martin/
New data from the US EPA on power plant greenhouse gas emissions are in, and electric vehicles (EV) in the US are even cleaner than they were before. The climate change emissions created by driving on electricity depend on where you live, but on average, an EV driving on electricity in the U.S. today is equivalent to a conventional gasoline car that gets 80 MPG, up from 73 MPG in our 2017 update. As grids get greener, and EVs also become more efficient, the so-called “long tailpipe” of the EV gets shorter and shorter. In all states except Hawaii, an efficient EV beats the most efficient ICE hybrid vehicle- in some locations by a factor of 3!
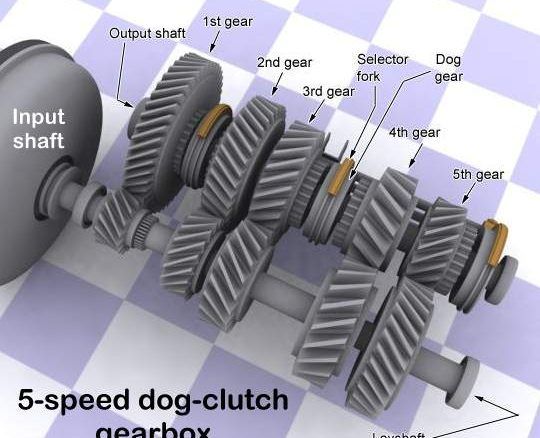
In some cases multi-speed gearboxes must be used; for example for extreme performance (acceleration/top-speed), heavy load/steep grades trucking, off-road high load/grade applications.
SOME BENEFITS OF MULTI-SPEED GEARBOXES
– keeps e-motor(s) in higher efficiency range improving overall efficiency of EV powertrain to deliver more range, or alternatively same range with a smaller battery pack, hence cost and weight reduction of the powertrain.
– lower torque motor can be used which results in cost benefits and an overall reduction in the weight of the powertrain or alternatively, with same motor, it can deliver better performance at higher level of efficiency.
– offer better launch acceleration, lower noise and a higher cruising speed, while the hill climbing ability of utility vehicles can be improved.
– simpler, lighter and cheaper power electronics, and because the motor can be kept within its optimum speed range there’s less wear.
– for both high acceleration requirements and extreme top speed requirements, to avoid extremely wide RPM e-motors/controllers, multi-speed is required.
– for extreme grade, terrain and carrying load requirements, multi-speed is required or the motor/controller sizing will not be cost-effective.
HOWEVER, if you are fortunate enough to be able to design your own optimized motors/controllers for specific mission “low duty” usage profiles, as Tesla does, single-speed gearboxes do come out ahead – however in some circles, the debate rages on whether multi-speed gearboxes can be justified to benefit these non-heavy duty applications. Another approach is rather than use multi-speed gearboxes, use front and rear motors with different single-speed ratios, than the control system directs more power to the motor with the better gear ratio for the specific situation.
SOME CASE STUDIES PROVE OUT THESE BENEFITS:
1 – DCT Transmission specialist Vocis’s simulations show that their 2-4SED two-speed configuration could reduce the battery energy consumed by up to 15%
(4SED tests reached 15%) over the industry-standard New European Drive Cycle, without any significant increase in overall cost or packaging volume, as well as extending battery life and providing the potential to substantially downsize the powertrain and battery pack.
The 4SED system resembles a dual-clutch transmission configuration, but with two motors instead of twin clutches. There are two input shafts, each driven by its own electric motor. The two motors replace the usual clutches and synchronisers, allowing the next gear to be preselected before the previous one has been disengaged, and can synchronise shaft speeds. Fewer software algorithms needed compared to a normal automated gearbox, and because there are no hydraulics, there is no need for valve control.
https://newatlas.com/new-multi-speed-electric-vehicle-transmission-improves-ev-performance-and-range/11670/
https://www.autoblog.com/2011/08/19/vocis-says-two-speed-electric-vehicle-transmission-will-boost-ba/
http://www.vocis.co.uk/2-speed-electric-minibus/
http://drivesncontrols.com/news/fullstory.php/aid/4036/Two-motor_powertrain__91can_raise_EV_efficiencies_by_15_25_92.html
http://user49750.vs.easily.co.uk/wp-content/uploads/2014/05/4SED-paper.pdf
2 – Zeroshift’s concept prevents any torque interruptions during ratio changes and does not require a clutch, an issue that may have deterred EV manufacturers from fitting multi-speed gearboxes. Zeroshift studies suggest that by using a compact, multi-speed transmission and a smaller electric motor, manufacturers can gain an operating efficiency of up to 10% or more. You can use that 10% to improve EVs’ range or reduce the size, weight and cost of battery packs. The benefits of Zeroshift’s transmission would be greatest for electric delivery vehicles where the compromises in efficiency are greatest. To be able to pull away fully laden on hills requires low gearing, but the motor then runs too fast and too inefficiently on the highway. Also Zeroshift is less expensive to manufacture than a continuously variable transmission (CVT) or a dual clutch transmission (DCT), says Bill Martin, Zeroshift’s managing director.
There are several motorcycle seamless shift systems available, but the Moto GP teams are keeping tight-lipped about whose technology they are using. Two British companies, Xtrac and Zeroshift, produce the technology, but neither is willing to confirm their involvement with a particular team. Zeroshift though was willing to explain the workings of its system.
http://www.zeroshift.com/
http://www.greencarcongress.com/2010/08/zeroshift-20100819.html
https://www.highpowermedia.com/blog/3212/motogp-transmissions

By Jason B. Hunt, guest contributor
A little while back, it was written that self-driving cars will need people, too. Studies have indicated that people are generally interested in if not excited by the chance to relax fully when riding in the self-driving cars of the near future. People want to read, nap, watch TV and movies, and potentially even consume alcohol while the automated car does all the work. Yet it was suggested that the desire for this sort of ride was likely somewhat ambitious. The logic was that even if an automated vehicle can handle itself 99% of the time without problems, that last 1% – amplified over tens of thousands, and eventually millions of drivers – would result in some real problems of unacceptable frequency.
That may in fact be the case, and it may not be a problem we can fix in the next few years. Apple, however, seems to be betting otherwise. With recent reports hinting that an “Apple Car” could be coming out within the next two-to-four years, the most valuable tech company in the world is starting to make some noise as relates to driverless tech. And to put it in the most straightforward way possible, The Street writes that Apple has patents for virtual reality in autonomous cars.
What does that mean, exactly? Well, the early reports are that it means passengers in an Apple (or possible Apple tech-infused) driverless car will be able to <em>shoot zombies</em> in a VR experience that goes hand-in-hand with the car ride. It’s an idea that almost seems like a joke the first time you read it, and yet it’s one that appears to be very real. And it raises the idea that self-driving cars could be used not just to allow drivers to relax, but specifically to entertain them as they go. One wonders what other VR experiences could possibly work in this sort of situation, and these are a few ideas that come to mind.
Car Chase Shooters – This is a little bit of a creepy concept, because in a way it’s simulating combat between your vehicle and others on the road. But we’ve already taken shooters to incredibly realistic levels, so it’s probably a likely possibility. In fact, if we’re to be battling zombies, we may as well be in first-person, Grand Theft Auto-style shootouts while our self-driving cars steer us along. It would certainly help pass the time, though it could also make riding legitimately scary.
Racing Games – This seems like the obvious choice for a VR game based in a driverless car, though it might be trickier than we imagine. Racing games require pace, and there’s a chance that getting caught up in that kind of pace while your actual car is moving along at what would be a slower and less erratic pace could lead to motion sickness or something similar. That said, if the ride is smooth enough, the fact that you could be sitting in a real car seat, perhaps with a steering wheel-like controller, could make it feel incredibly realistic also.
Casino Games – There’s something to be said for some of the simplest VR experiences making it into cars as well, so as to provide passive entertainment without any of the action and speed that could cause the motion issues mentioned above. Casino gaming could mean simulated poker or blackjack tables, or even slots and arcades that come to life around you. 3D gaming styles have taken over the slot genre already, and a couple of the popular games that have thrived in 3D have been turned into VR experiences already. They’d make for excellent road trip entertainment with relatively little hassle or risk of discomfort.
Audioshield & Fruit Ninja – These are a little bit different because they’re specific games rather than genres. But in a way they’re similar. Fruit Ninja just means slashing fruit as it falls in front of you in 3D space; Audioshield works like VR guitar hero , only with punching motions instead of a plastic guitar. But both mean you’re simply staying in place and reacting to elements coming at you – something that almost sounds downright pleasant as you sit in a comfortable car seat moving along on your way.
by S.E.Tice…
Battery (only) Electric cars (aka BEVs) cost LESS to Maintain than conventional ICE powered (internal combustion engine) vehicles – this is an universally agreed truth!
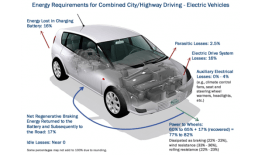
(Also true, they cost LESS to Operate for the consumer, partly because they are ~3x more efficient than an ICE powered car, especially if the owner “fuels” up with their own solar electric panels, battery storage, net energy metering. BEVs are the most efficient, as they use 80% of energy onboard to move the car down the road (much higher than conventional powered vehicles) but that subject is for another post)
You would be surprised to learn how many non-Tesla dealership sales people fail to mention either or both of these BEV advantages (BEV – Battery only Electric Vehicle) . BEVs cost less to maintain than conventional vehicles because:
1 – Significantly less mechanical brake maintenance from less wear due to regenerative or dynamic braking. BEVs recapture a portion of their kinetic energy for braking, by using the motor(s) as generator(s) to slow down the vehicle and put that energy back into the battery to extend range – rather than use of their mechanical brakes, which create heat and dust wearing down the pads and their rotors. (Even diesel-electric locomotives use dynamic braking, dissipating their captured energy into resistor banks, because they typically do not have battery banks OR, if they are grid tied, send the energy back to the grid.)
2 – The battery, motor, and associated electronics require little to no regular maintenance. There are fewer fluids to change than in a typical gas/diesel (ICE – internal combustion engine) powered vehicle.
3 – There are far fewer moving parts to wear out relative to a conventional ICE.
Maintenance is one of the 6 contributors to TCO – total cost of ownership. The other 5 are: Purchase, Insurance, Depreciation, Tax and “Fuel” Cost (whether dino-fuel or electric).
2015 study clearly shows lower maintenance costs in four regions around the world. Unfortunately, as far as “fueling costs”, this study does not seem to show the cost advantage of BEV owners fueling their vehicles with their own solar electric panels – https://cleantechnica.com/…/new-study-finds-electric-vehic…/
BEVs also cost less to operate – (regen braking adds 15-20% to the overall efficiency) – https://insideevs.com/bevs-80-percent-energy-move-car/
https://avt.inl.gov/sites/default/files/pdf/fsev/costs.pdf
https://www.ucsusa.org/…/a…/2017/11/cv-report-ev-savings.pdf
https://www.solar-estimate.org/…/2018-03-07-do-electric-veh…
COMPARED TO COMPETITOR KITS
-> Our kits really do come pre-wired with only plugs to plug into and ready to drop into donor vehicles vs. most competitor kits are not pre-wired, all wire/cable and connectors/terminals are loose, so customer needs to cut and make all wire harnesses
-> Kits come with a complete installation video to show the customer how to install kit themselves step by step vs. most competitor kits that simply sell you a pallet of components with a wiring diagram, but no real instructions on how exactly to properly create all wired connections, mount all parts, sequence of operations and start-up of the powertrain, etc.
-> Kit has a BMS based ESS to maintain and extend battery life, a large part of the kit cost/ investment by the customer
-> More Energy for more Range with ~32 kWh ESS and higher quality battery cell tech using high performance 18650 cells vs. most competitor kits use only ~22kWh consisting of low energy density ( heavier for same energy) LiFePO4 prismatic cells
-> Higher system voltage for more efficiency of 144Vdc vs. ~96Vdc most competitors use
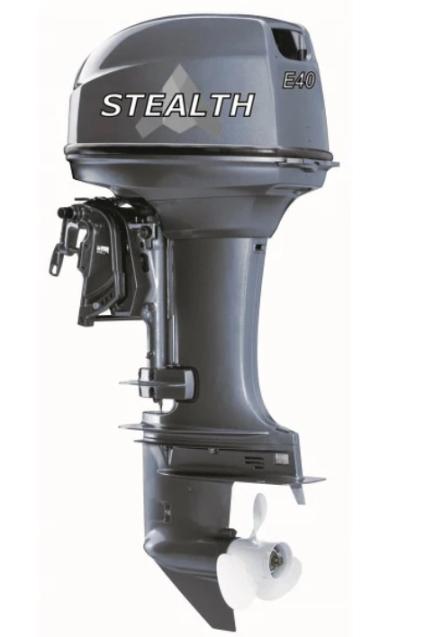
SE40V2.0 144Vdc Electric Outboard kit – Ideal for powering vessels under 20 feet such as RIBs, Pontoon boats Jon boats, where 40hp gas outboards are used for up to ~30mph.
Specs: 40hp/30kW at the prop. 20″ shaft length. Battery system (ESS) 144Vdc nominal – should be minimum ~26kWh (can be less for low performance duty cycle applications), 200 Amp continuous, 300 Amp peak (not included in this package) – max 180Vdc charging top-off. 179lb/81kg total weight. Electric trim and tilt. Liquid-cooled controller and brushless PMAC motor (same as used in our QWC/SEV-55kW peak drive subsystem kit) Bluetooth wireless app. Lower unit is a version of a Yamaha compatible design so all traditional lower unit parts can be purchased at your local Yamaha parts dealer. Throttle and custom cable set also included in this package. Here’s the best part, this electric outboard has all the power of the market leader “ Deep Blue 40” at the approximate price range of the market leader Cruise 10.0, finally an affordable solution! (NOTE: When ordering, we will need to get specific boat length for custom cable set that is included in package. Boat should be under 1,000 lbs gross vehicle weight with e-outboard, ESS passengers and cargo and transom rated for at least 40hp.)

